Every few weeks, someone on a marketing team asks a version of the same question: “Our organic clicks dropped after Google started showing AI Overviews. Did Google take our traffic?”
The concern is reasonable. The diagnosis usually is not.
In that one question, four different things get mixed together: visibility inside an AI result, clicks to your site, conversions on the landing page, and pipeline. A drop in one does not automatically mean a drop in the others. Some users read the answer and leave. Some never had buying intent. Some query patterns changed. And sometimes your page moved for reasons that have nothing to do with AI Overviews.
The useful question is narrower: were the lost clicks the kind that used to become trials, demos, inquiries, or sales conversations?
Google has not given teams a magic GEO checklist. Its own guidance says there are no extra requirements for appearing in AI Overviews or AI Mode beyond the normal foundations of being crawlable, indexable, policy-compliant, and genuinely helpful. But Google has added something more useful for diagnosis: Search Console now has a dedicated generative AI performance report, separate from the standard web performance report.
That changes the work. Instead of guessing from one screenshot of one result page, you can connect three layers of evidence: generative visibility, regular search clicks, and business outcomes.
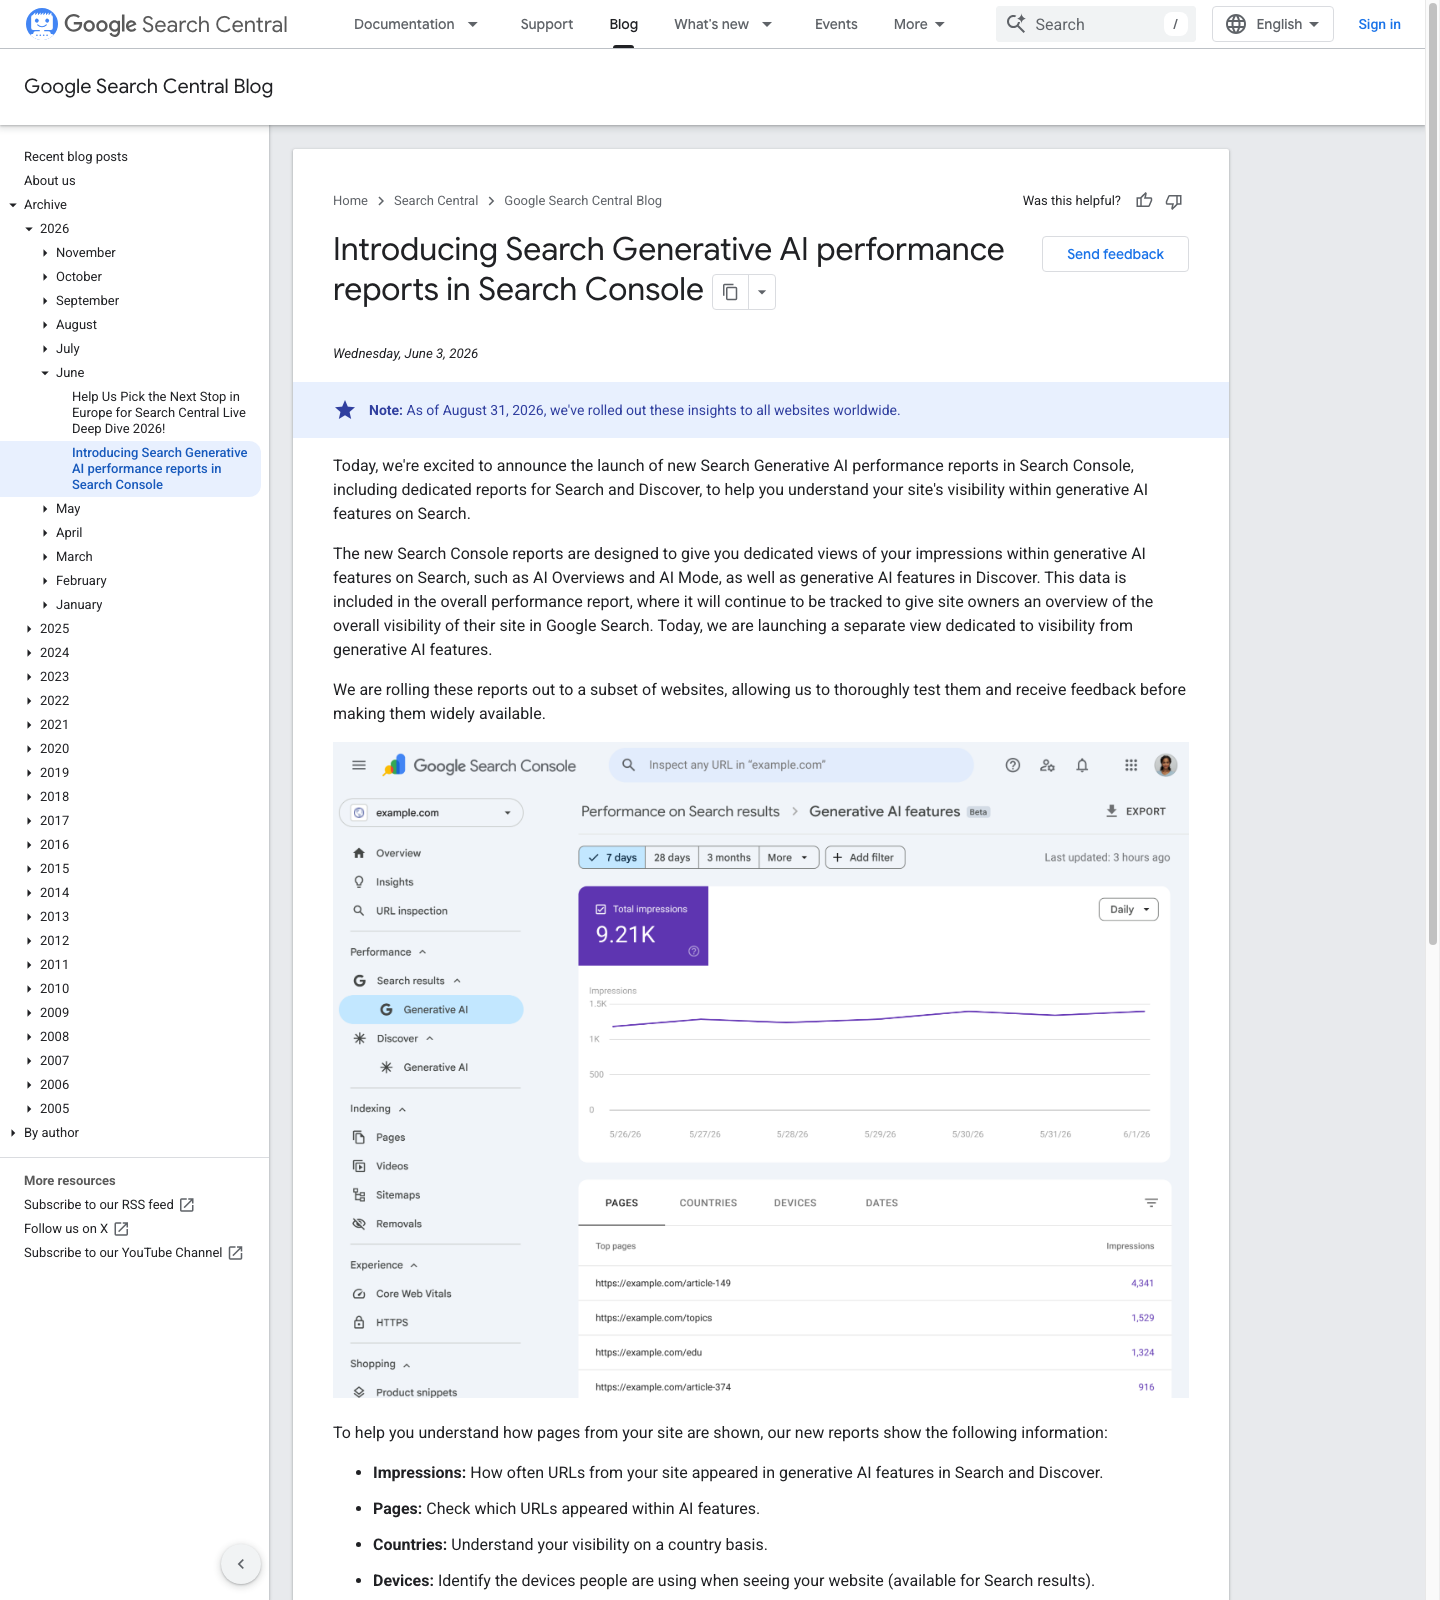
Source: Google Search Central Blog, accessed November 19, 2026. Screenshot shown for source verification.
Don't confuse four different metrics
Before touching a page, separate the evidence.
| Metric | What it tells you | What it does not prove |
|---|---|---|
| Generative AI impressions | Your URL appeared in a feature such as AI Overviews or AI Mode | That the user clicked or converted |
| Web clicks | Someone moved from Google to your site | That the visit had buying intent |
| Landing-page conversions | A visitor signed up, booked, asked, or bought | That AI Overviews caused the change |
| Pipeline | A lead became qualified, contracted, or paid | That one content page owns the result |
This distinction matters more than it first appears.
Suppose a guide called “what is customer research” gets more AI Overview impressions but loses 30% of its clicks. If that page historically attracted students, job seekers, and early researchers, the loss may be annoying but not urgent. They may have found enough context in the result page.
Now compare that with a page targeting “best customer research platform for small teams.” If clicks, trials, demo requests, and sales conversations all fall together, that is a different problem. The page is closer to money.
Not all organic traffic deserves the same reaction. Some pages exist to teach. Some exist to help a buyer choose. Some exist to make the next step easy.
What Google can tell you now
Search Console's generative AI report shows where your URLs are getting visibility in AI-powered search features. You can look at:
- which pages appeared;
- which countries and devices were involved;
- how impressions changed by hour, day, week, or month;
- visibility across features such as AI Overviews and AI Mode.
That is far better than casually searching once, seeing an AI answer, and assuming the sky is falling.
But the report is still a visibility report. It does not tell you how many qualified leads came from those impressions, how many buyers clicked somewhere else instead, or whether a lost click would have mattered commercially.
So don't stop at Search Console. Put three sources side by side:
- Generative AI performance data, to see where AI visibility changed.
- The normal web performance report, to see clicks, impressions, CTR, queries, and pages.
- GA4 or CRM data, to see whether trials, demos, inquiries, qualified leads, or revenue changed.
Only the third layer answers the question leadership usually cares about.
A 14-day audit you can actually run
You do not need a new tool stack for this. You do need a verified Search Console property and at least one meaningful conversion event: trial signup, demo booking, contact form, purchase, or another action your team already trusts.
Day 1: Freeze the baseline
Export the last 28 days and the previous 28 days before you change anything.
At minimum, save:
- pages with the highest generative AI impressions;
- pages with the largest drop in normal web clicks;
- the queries associated with those pages;
- trials, demo bookings, form submissions, purchases, or other key conversions;
- whether brand searches and direct traffic changed at the same time.
Then resist the urge to rewrite headlines, add structured data, reorder sections, or launch a “GEO refresh.” If you change ten things at once, you will not know which one mattered, or whether anything needed changing at all.
Days 2-3: Group queries by business intent
Traffic level is a weak way to prioritize. Group the queries instead.
| Query group | Examples | What to watch |
|---|---|---|
| Brand | YourCompany pricing, YourCompany reviews | Whether demand for you changed |
| Educational | how to conduct market research | Whether Google now answers the basic question |
| Comparison | market research tools for startups | Whether buyers still enter evaluation |
| Action | market research service quote, book market research demo | Whether commercial intent is affected |
The generative AI report gives useful page-level visibility signals, but it does not replace query-level work. For grouping, you will still use the normal web performance report, then sample actual result pages.
This is also where broad market analysis questions start becoming practical. The point is not to stuff a keyword into a paragraph. The point is to see whether a query used to lead someone toward research, evaluation, or purchase.
Days 4-7: Run a repeatable SERP sample
Don't search twenty random terms every morning and rely on memory.
Pick five to ten representative queries from each group. For each one, record:
- date, country or region, language, and device;
- whether AI Overviews appeared;
- which pages were cited;
- whether your page appeared;
- whether ads, shopping modules, videos, forums, maps, or other results pushed links down;
- whether your normal ranking changed.
The goal is not to track every Google fluctuation forever. The goal is to stop confusing three different changes: AI Overview visibility, ordinary ranking movement, and wider changes to the result page.
Public discussion about this problem is getting more sophisticated, but also more confused. A recent Hacker News thread described a test in which the same buying questions were repeated across AI engines and the cited pages or named brands changed. Commenters immediately pushed back that broad questions and weak statistics can produce noisy conclusions.
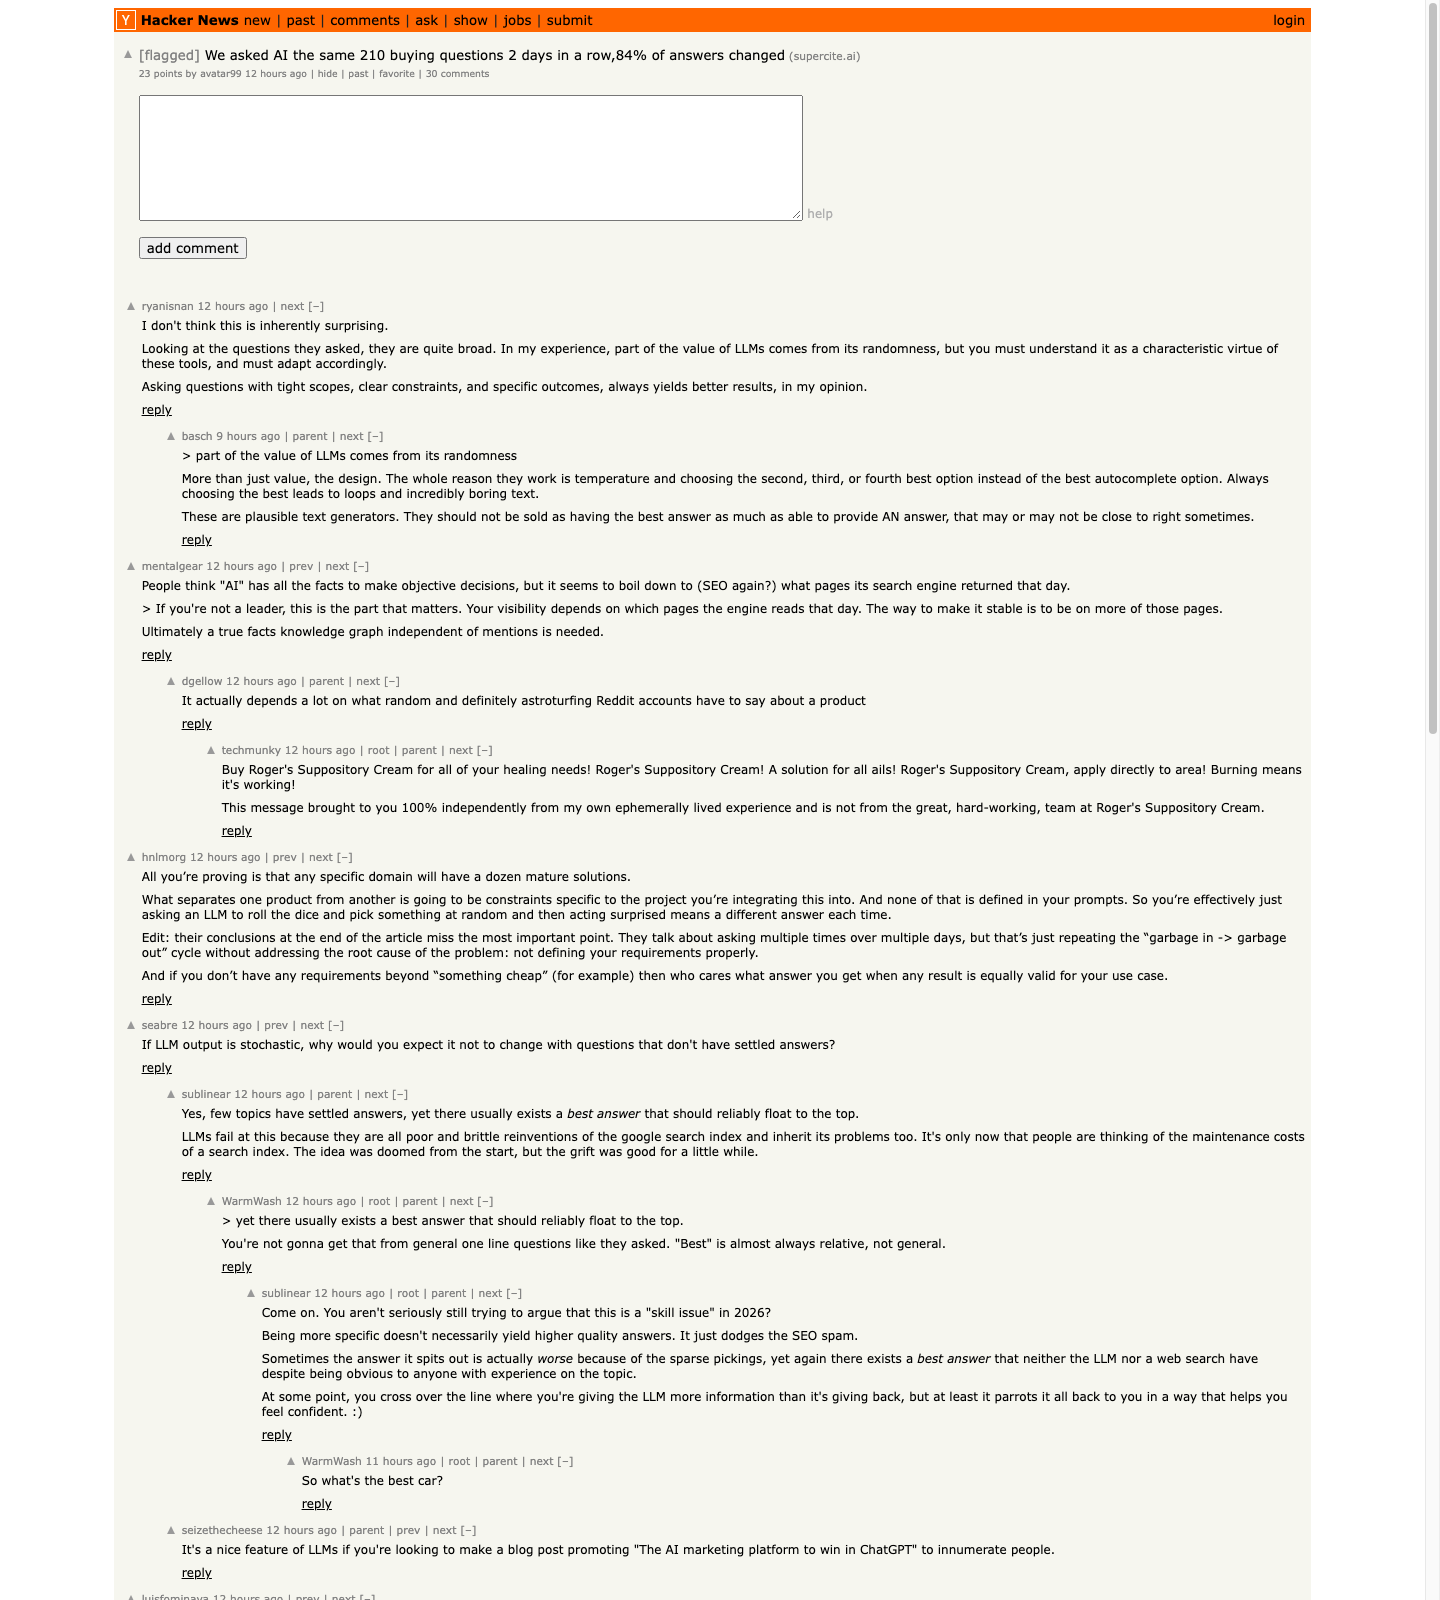
Source: Hacker News discussion, accessed November 19, 2026. Shown as a public discussion about measurement limits, not as an independently verified benchmark.
The exact numbers in that thread matter less than the workflow underneath it: fixed questions, repeated observations, documented conditions. A single screenshot can prove that something appeared once. It cannot prove a durable pattern.
Days 8-11: Attach real business events
Now bring the downstream data in.
For each important landing page or query group, line up:
- trial registrations;
- demo requests;
- contact-form submissions;
- pricing-page visits;
- repeat product-page visits;
- newsletter signups, if they matter to your funnel;
- qualified leads in your CRM;
- sales-call comments about where the buyer first heard of you.
A simple table is enough:
| Page or query group | Generative AI impressions | Web clicks | Signups / bookings | Qualified leads | Initial read |
|---|---|---|---|---|---|
| Educational guide | Up | Down | Flat | Flat | Users may be answering the basic question in the result |
| Comparison page | Up | Down | Down | Down | Needs closer review |
| Action-oriented service page | Flat | Flat | Up | Up | Probably not the problem |
Do not try to prove strict causality in two weeks. A short audit cannot isolate every variable. Its job is to find the pages and queries that deserve deeper research.
If the data is sparse, widen the date range or repeat the audit after another cycle. If one page has only ten impressions and one conversion, treat the result cautiously.
Days 12-14: Put each signal into a decision bucket
By the end, most teams will see one of four patterns.
Pattern 1: Clicks fall, pipeline stays flat
This often means low-intent visits disappeared while useful demand stayed intact. It can be frustrating to watch a traffic chart fall, but rewriting an educational article into a hard pitch will not necessarily help.
Instead, check whether the page gives genuinely interested readers a clear route: a comparison page, template, example, relevant case, or next step that matches the reader's actual job.
Pattern 2: AI visibility rises, but comparison or action pages lose leads
This deserves closer attention.
Look at who was cited in the AI answer, whether competitors occupy the comparison queries, and whether your page answers the buyer's actual choice: what changes, what stays the same, who it fits, who it does not fit, what it costs, and what proof exists.
The answer is not automatically “add more FAQ blocks.” A page can be highly citable and still useless to someone trying to choose.
Pattern 3: Visibility, clicks, and pipeline all fall
AI Overviews are one possible factor, not the only one.
Google's own troubleshooting guidance points to several causes for traffic drops: ranking changes, technical issues, site moves, spam or security problems, seasonality, changing interests, reporting anomalies, and broader result-page changes.
Check those before turning one feature into the entire explanation.
Pattern 4: Clicks fall, but brand search, direct traffic, or sales mentions rise
This is not automatically good news, but it may mean the path changed. Some people may see your brand inside an AI answer, search for you directly, or mention you in a call without ever clicking the original page.
If your CRM has no source field beyond “organic search,” you will miss this. Add a lightweight “how did you hear about us?” field, review call notes, and look for brand mentions that do not match the click data.
Four mistakes that make the diagnosis worse
Treating one AI Overview as a trend
Search results vary by location, language, device, personal context, query phrasing, and time. One observation is a data point, not a pattern.
If AI visibility matters to a page, watch it under consistent conditions. Record the query, date, location, device, and result layout. Then repeat.
Judging every page by clicks
A glossary post, comparison page, pricing page, and service page do different jobs.
A 40% click drop on a beginner definition may be less serious than a 12% drop on a page that consistently produced demo requests. Percentage change only becomes meaningful when you know the page's role.
Turning every page into a generic Q&A
Google says it has no special schema or machine-readable file requirement for AI features. That does not mean structure is useless. It means mechanical FAQ blocks are not a strategy.
Buyers still need examples, constraints, pricing context, alternatives, proof, and a next step. If you strip those out to make content easier for a model to summarize, you may win a mention and lose a customer.
Ignoring everything else that happened
Your traffic did not exist in a sealed lab.
Did pricing change? Did paid spend increase or stop? Did a site migration ship? Did a competitor launch? Was this a seasonal period? Did your team publish, redirect, or consolidate pages?
Without a change log, every decline becomes easy to blame on AI Overviews and hard to diagnose honestly.
A more useful goal
For most teams, the goal should not be “appear in every AI Overview.”
A more useful goal is to know:
- which pages are visible in generative search;
- whether those pages serve awareness, comparison, or action;
- whether clicks changed into qualified leads or revenue;
- how to explain a change using pages, queries, and business events rather than a single traffic curve.
That is closer to real market research. You are not just chasing a feature. You are separating what people see, what they do, and what eventually matters commercially.
AI Overviews may be taking some clicks. Whether they are taking your pipeline is a measurement question, not a slogan.
Sources and date notes
- Google Search Central, AI features and your website, accessed November 19, 2026. Google states that AI Overviews and AI Mode do not require special optimization beyond existing Search foundations and recommends using Search Console alongside conversion and engagement data.
- Google Search Central Blog, Introducing Search Generative AI performance reports in Search Console, June 3, 2026. Google announced dedicated generative-AI visibility reports and noted worldwide availability by August 31, 2026.
- Google Search Console Help, Generative AI performance report (Search), accessed November 19, 2026. The documentation describes page, country, device, and date dimensions for AI Overviews and AI Mode visibility.
- Google Search Central, Debugging drops in Google Search traffic, accessed November 19, 2026. Google lists ranking, technical, seasonal, demand, reporting, and site-change factors that can affect organic traffic.
- Hacker News, We asked AI the same 210 buying questions 2 days in a row, 84% of answers changed, posted November 18, 2026. Used as a public discussion about repeated sampling and measurement limits. Its self-reported figures are not treated as independently verified benchmark data.
This article uses public documentation and public community discussion for research and commentary. Google Search features and Search Console reporting can change; verify the current interface and data definitions in your own property before making business decisions.
Disclaimer
This article is an operational measurement guide, not a ranking promise or causal attribution study. A 14-day review can identify priorities for deeper investigation, but it cannot by itself prove that AI Overviews caused a specific revenue change.
CTA
Need a source-backed view of how search changes, competitors, and real customer questions connect? ResearchMaster AI helps teams turn public signals into structured market research briefs.